I n f o g r a p h i c
Policy Brief: Bridges to Prosperity
Research | Data Visualization | Editorial Design
T h e B a c k g r o u n d
This was my volunteer project for Viz For Social Good (VFSG) in collaboration with Bridges to Prosperity (B2P). B2P builds bridges over impassable rivers, and the impact is life-changing for rural communities.
T h e D e l i v e r a b l e
A policy brief on their impacts in an infographic format (evidence-based communication). Ideally, graphs in the infographic should be reusable in other publications in the future.
T h e C h a l l e n g e
The client was faced with a unique challenge: There was very little data to visualize, only 1-2 numbers in most cases. They struggle with finding interesting ways to showcase those simple numbers. They felt that the numbers are so significant, that it deserves to be shown in an engaging and impactful way to get the donors attention. Their audience consists of governments and other funding agencies.
T h e S o l u t i o n
By conducting research on relevant publications, I was able to gain a deeper understanding of the topic. I leveraged this knowledge to build additional context for each data narrative, and designed diagrams to show the relationships of the data points, connecting the dots for readers.
The result: Visually engaging and impactful graphs that clearly communicates the data and key messages. Each graph can be stand alone or part of a report.
The result: Visually engaging and impactful graphs that clearly communicates the data and key messages. Each graph can be stand alone or part of a report.
A project by Maggie Shi
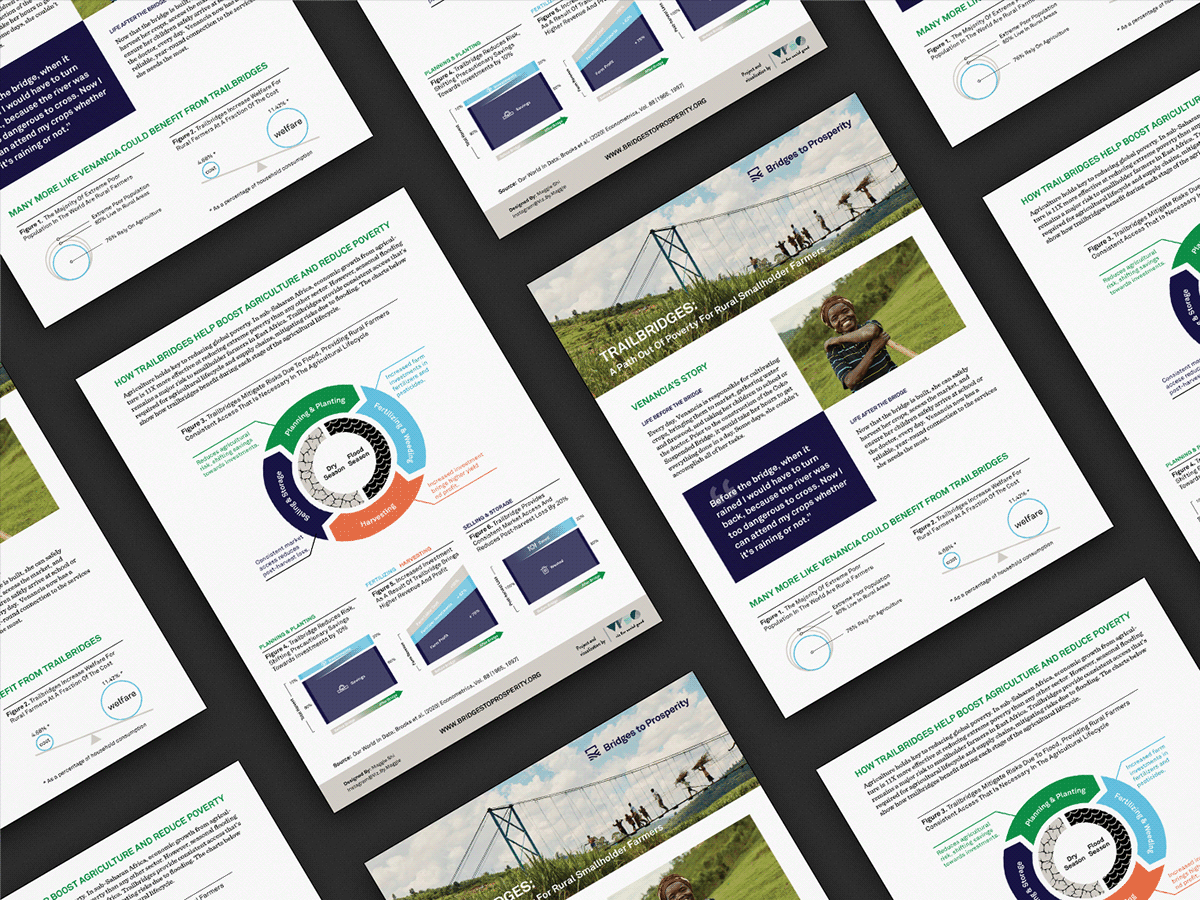
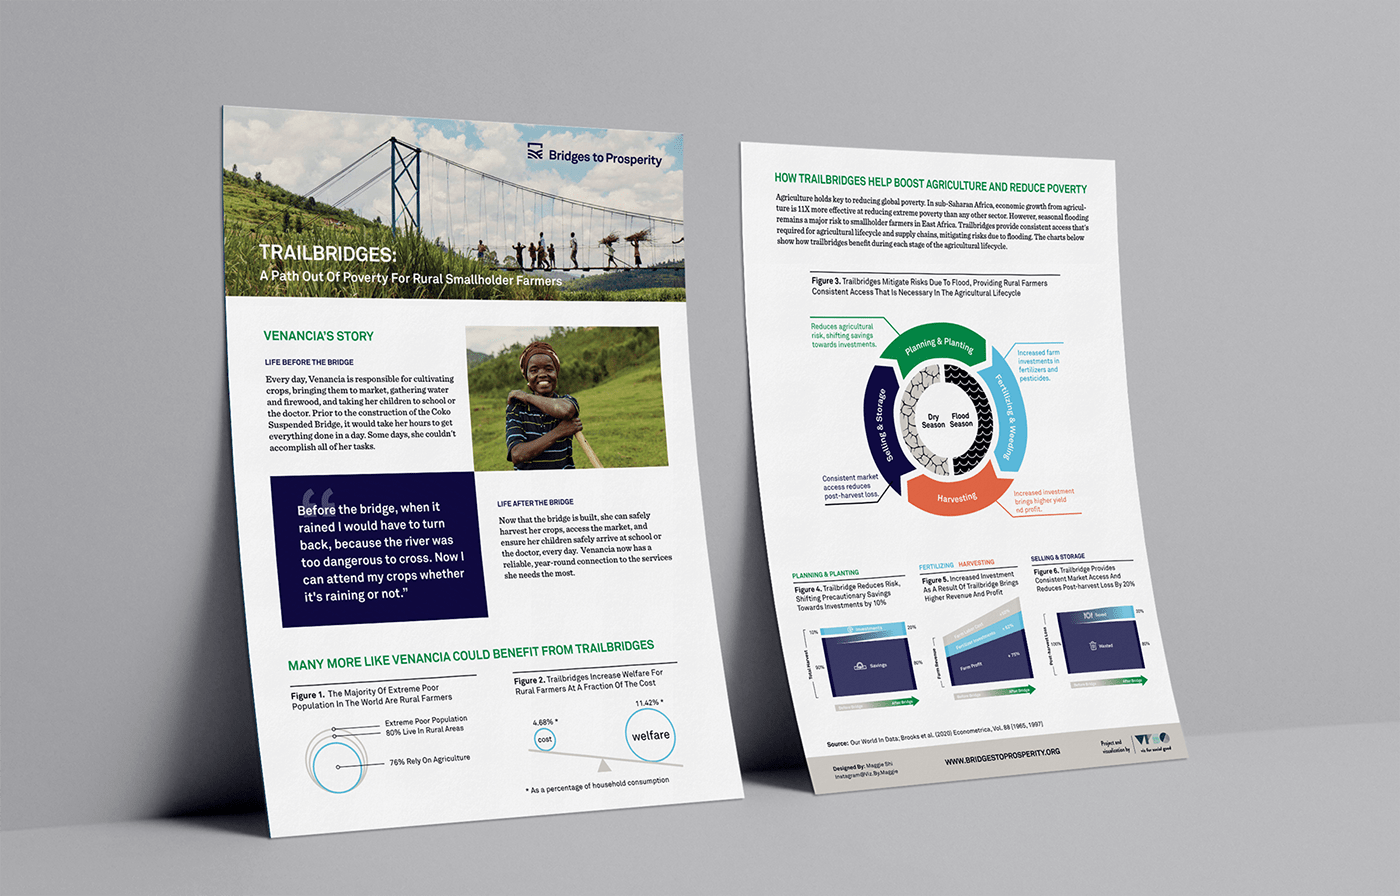
The Brief (Page 1-2)


The Data Visualizations


The Process
Step 1. Analysis & Strategy
Identify key information in client brief such as: the pain point, audience, format, goal, timeline, etc., and develop design strategy accordingly.
e.g. Pain point: too few data points, looked insignificant → Find context to supplement data, eye-catching visuals, clear message.
Audience: government → Use common graphs, not too fancy. Brief need to be skimmable.
Goal: Build awareness leading to donation → Provide background. Use narrative structure. Humanize the story.
Format: A4 print → CMYK color, text size, margin, bleed.
Format: A4 print → CMYK color, text size, margin, bleed.
Step 2. Research
This is an important step before jumping into designing mode. I conduct research to understand the topic, validate the data sources, and collect additional data and relevant information.
I look for answers to questions such as: What is the problem? What's causing it? Why should the audience care?
What is the proposed solution? How do we know it works? What's the alternative?
What do we ask people to do? What if they do nothing? How urgent is this?
Some publications I've read for this project:

Step 3. Sketch
This is when I sketch out data charts and diagrams. I go through iterations to find the best visual representations.

Step 4. Storyboard
In this step, I explored the best way to arrange the data graphs and narratives to form a coherent story.

Step 5. Design in illustrator
This is the final step, where I digitize all the sketches, source photos, and design the layout for the policy brief following the client's brand guidelines.

The Final Design